Monitor Dashboard
The Monitor Dashboard is your real-time window into everything happening on your layout. It streams live data in a split-screen layout designed for at-a-glance monitoring.
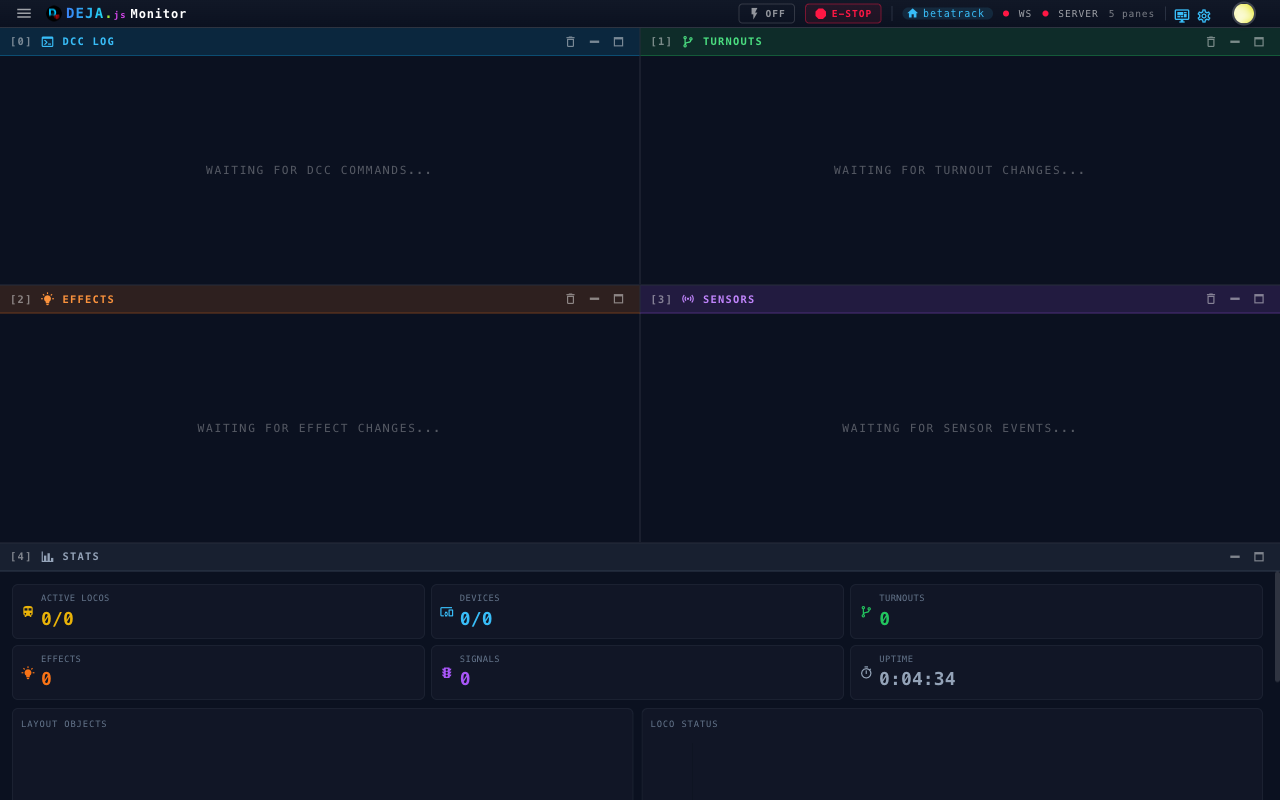
Upper Half — Log Panels
The top of the screen shows three live event streams side by side:
| Panel | What you'll see |
|---|---|
| DCC Log | Every DCC-EX command flowing through the system — throttle changes, turnout throws, function toggles, power commands |
| Turnout Logs | Real-time turnout state changes as they happen — turnout ID and new position (thrown/closed) |
| Effect Logs | Effect activations and deactivations — which effect fired and its updated state |
Each panel scrolls independently. Click any panel to expand it to a full-screen log view.
Lower Half — Device Serial Monitors
The bottom shows serial output from your connected hardware devices. Each device registered in your layout gets its own monitor panel displaying raw serial communication — useful for debugging hardware issues or verifying that commands are reaching your devices.
Click a device panel to open its dedicated full-screen serial monitor.
Statistics Cards
Summary cards at the top of the dashboard provide key metrics at a glance:
- Layout — Current layout ID and connection status
- Turnouts — Total count and recent throws
- Effects — Total effects, active effects, and signal counts
- Throttles — Total throttles and how many are currently moving
What's Next
- Log Viewer — Full-screen views for each log type
- Settings — Configure refresh intervals and theme