Monitor App
The Monitor app is your real-time diagnostics dashboard. It streams live DCC command logs, turnout and effect activity, and device serial output in a single split-screen interface. Use it to keep an eye on system health during operations or to debug issues when something isn't working as expected.
Getting Started
Open monitor.dejajs.com in any browser, log in with your DEJA Cloud account, and select your layout. The dashboard loads automatically and begins streaming live data from your server.
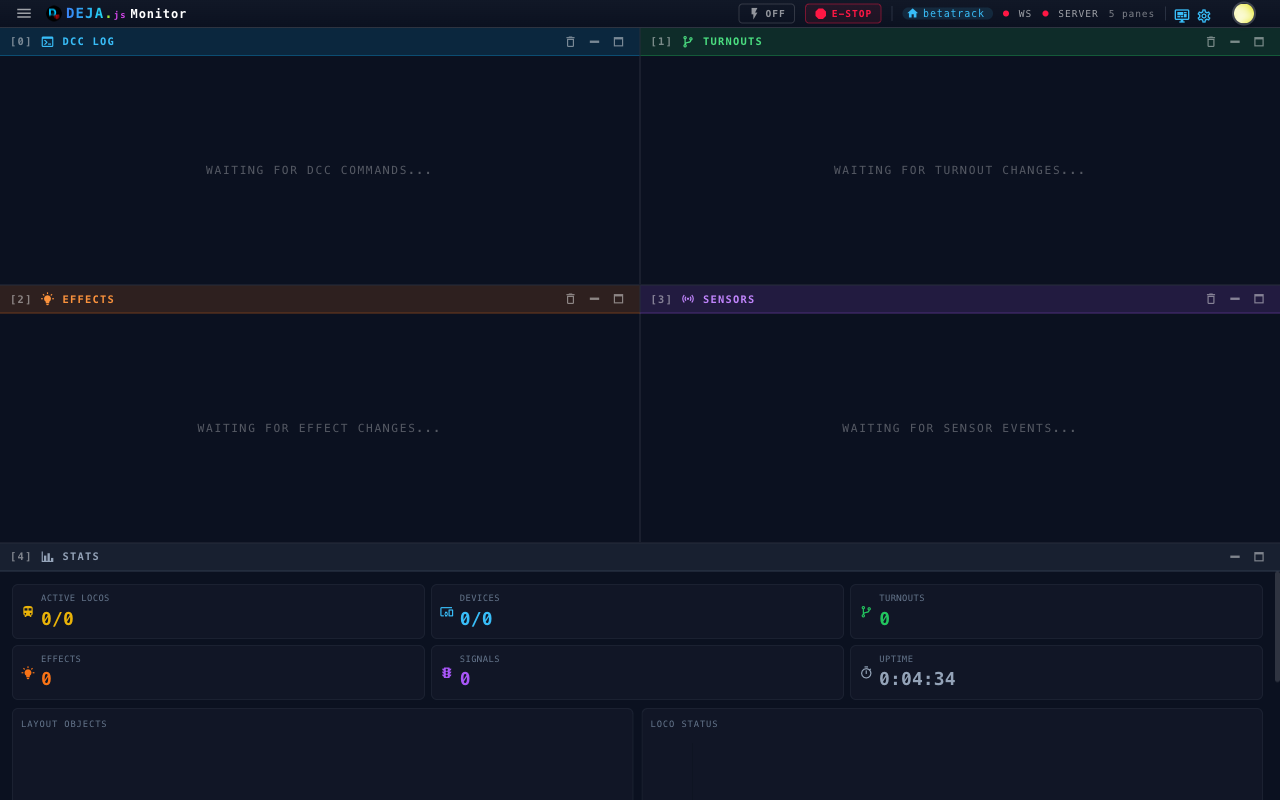
Dashboard
The dashboard is divided into two main regions:
Upper Half — Log Panels
Three log panels display live event streams side by side:
| Panel | What it shows |
|---|---|
| DCC Log | DCC-EX commands flowing through the system — parsed with action type and payload |
| Turnout Logs | Every turnout state change, showing the turnout ID and new state |
| Effect Logs | Effect activations and deactivations as they happen |
Each panel scrolls independently, so you can review one stream without losing your place in another.
Lower Half — Device Serial Monitors
The bottom half shows serial output from your connected hardware devices. Each registered device gets its own monitor panel, displaying raw serial communication between the server and that device.
Full-Screen Log Views
Click any log panel on the dashboard to expand it to a full-screen view. Each view includes a Live indicator confirming that real-time data is streaming:
- DCC Logger — All DCC-EX commands
- Turnout Logs — Turnout state changes
- Effect Logs — Effect activity
- Device Monitors — Serial output from all connected devices, or drill into a single device
See the Log Viewer page for details on each view.
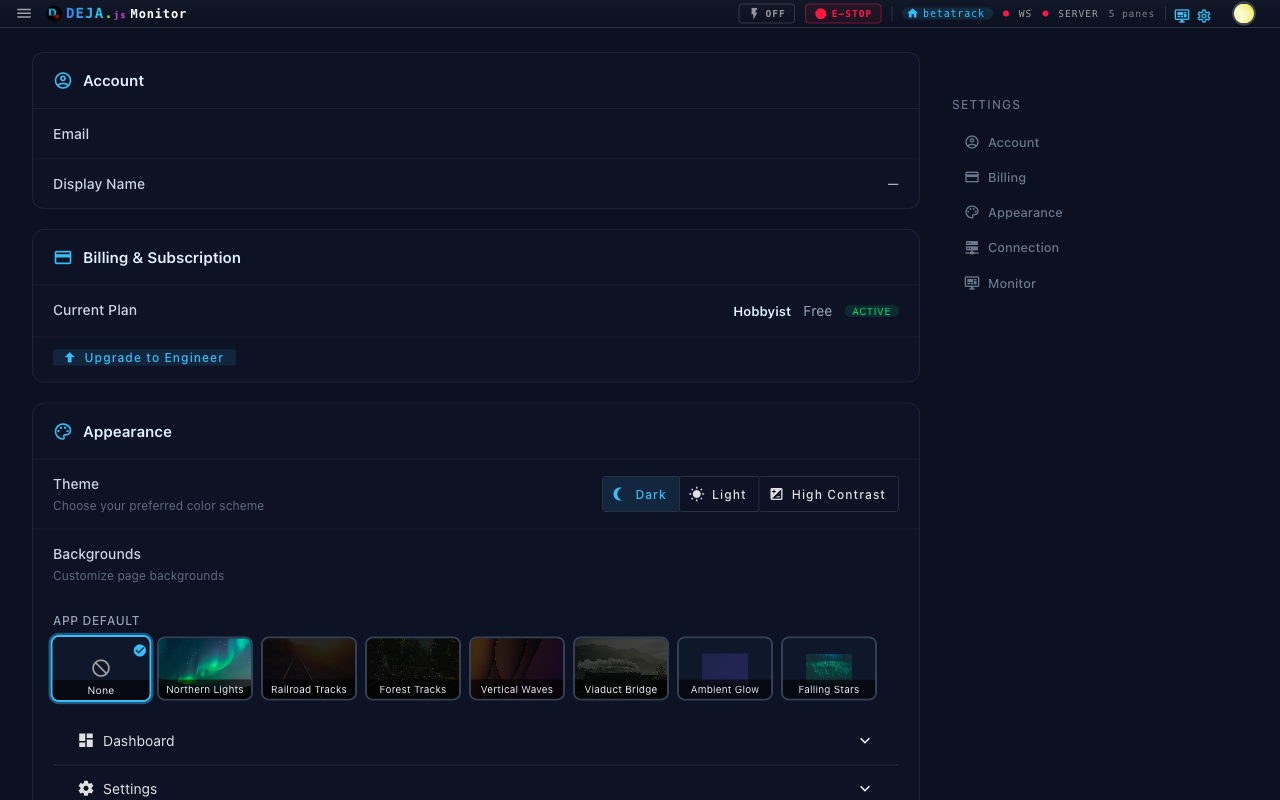
Settings
The Settings page provides controls for your monitoring experience:
- Auto-refresh toggle — Enable or disable automatic data refresh
- Refresh interval — Set refresh frequency (5 to 120 seconds)
- Dashboard theme — Switch between system default, light, or dark theme